
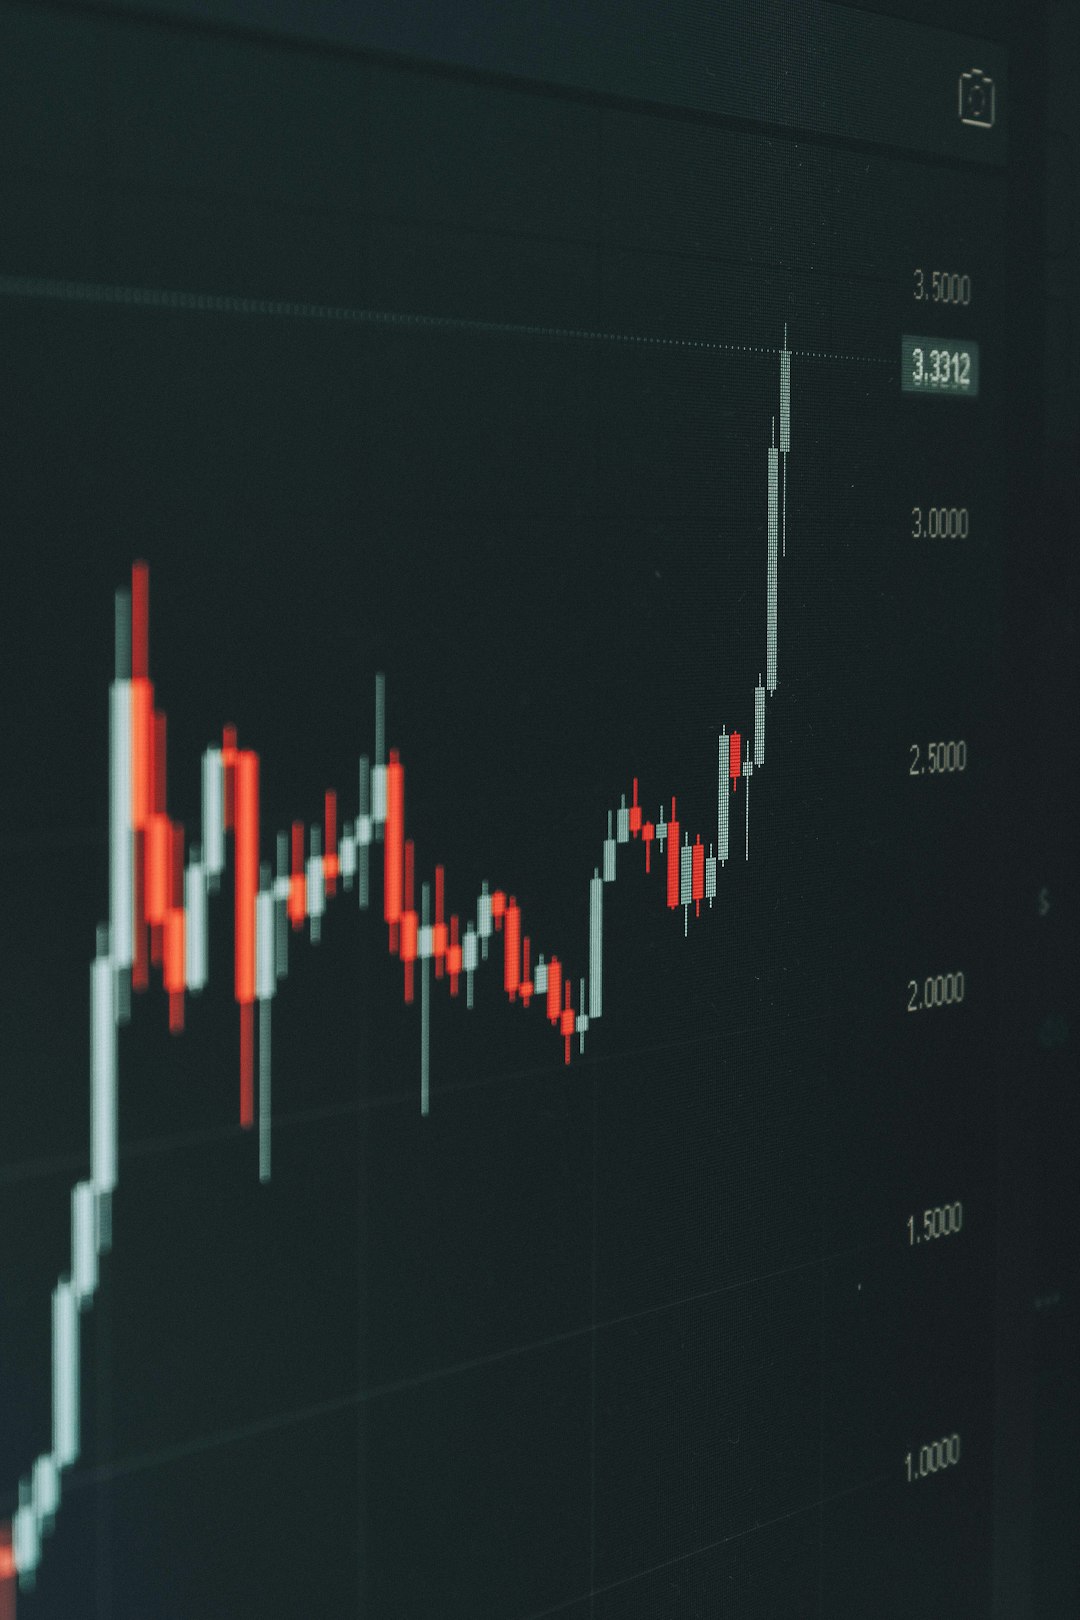
Professional and retail crypto traders across the United States are constantly seeking an edge in the fast-moving digital asset markets. One powerful tool that has gained popularity is the orderbook heatmap. These visual tools provide insight into real-time market activity, helping traders monitor whale movements and identify key liquidity zones. By leveraging heatmaps effectively, U.S. traders can better predict potential price action, optimize entry and exit points, and manage risk more accurately.
Orderbook heatmaps display the distribution of buy and sell orders across various price levels. The brighter and denser the heat signature, the more significant the volume at that price point. These tools, often integrated with platforms like TradingLite or TensorCharts, allow traders to visualize how large players — commonly referred to as “whales” — are setting their traps or preparing for major market shifts.
Top Strategies U.S. Traders Use with Orderbook Heatmaps
1. Spotting Whale Walls
Whales often place large limit orders — also known as “walls” — to influence price action. These orders create visual blocks on heatmaps that can either support or resist price movement. U.S. traders frequently monitor for these walls to determine whether:
- The wall represents genuine interest, suggesting price is unlikely to break through that level.
- The wall is a spoof, intended to manipulate sentiment before the order disappears.
Traders often combine heatmap analysis with volume spikes to distinguish authentic whale activity from deceptive tactics.
2. Identifying Liquidity Zones
Liquidity zones are areas on the heatmap where dense clusters of orders sit. These zones often act as magnets for price, drawing in price action due to the concentration of orders.
For example, a heavy buy zone around $30,000 for Bitcoin might signal a strong support level. Traders can plan entries or exits around such zones by analyzing the depth and consistency of the heat signatures.
3. Following Laddering Patterns
Whales commonly use laddering, placing multiple staggered orders at incremental price levels to appear less conspicuous. When visualized on a heatmap, laddered orders resemble staircases. U.S. traders track these patterns as clues to whale strategies — whether they are accumulating or distributing assets.
- If laddering appears below current price, whales may be setting up for a long position.
- If laddering is observed above current price, distribution could be taking place.
This kind of pattern recognition allows experienced traders to anticipate supply and demand shifts before they occur.
4. Time-Based Consistency Analysis
One of the more advanced tactics used by U.S. traders involves checking how long a particular heat zone or wall remains in place. Price pain points that persist across multiple timeframes, especially during high volatility, tend to be more significant than fleeting ones.
By tracking these longer-standing zones, traders can identify areas of critical interest where large players are likely to engage in meaningful positions.
5. Integrating with Technical Indicators
Although heatmaps offer real-time data on order flow, U.S. crypto traders often combine them with technical indicators like RSI, volume, and moving averages for better accuracy. A common strategy is to confirm a support zone on a heatmap with oversold RSI readings before executing a trade.
This multi-layered approach can strengthen decision-making and reduce the risks associated with isolated data interpretation.
Conclusion
Orderbook heatmaps represent a valuable visual front line in the battle for alpha in volatile crypto markets. When used intelligently, these tools help U.S. traders spot whale behavior, gain early insight into price pivots, and pinpoint zones of extreme liquidity. While no indicator is foolproof, a heatmap strategy combined with technical and fundamental analysis provides a robust foundation for smarter, more informed trading decisions.
FAQ
- Q: What is an orderbook heatmap?
A: An orderbook heatmap is a data visualization tool that shows the concentration of buy and sell orders at different price levels using color intensity. - Q: How does a heatmap show whale activity?
A: Whales often place large limit orders that appear as bright or dense areas on heatmaps. Traders track these zones to interpret potential price direction or manipulation tactics. - Q: What platforms offer heatmap functionality?
A: Popular platforms include TradingLite, TensorCharts, and Bookmap, all offering sophisticated heatmap features for crypto markets. - Q: Can beginners effectively use orderbook heatmaps?
A: Yes, but it requires practice and understanding of market dynamics. Beginners should start with simple observations like identifying support and resistance zones before diving into advanced strategies.


